This page covers how to navigate, use and download data from our gene pages, allowing you to get the most out of our IMPC resources. Our Gene pages are here to provide a structure and visual component to our whole data set.
Contents:
- Gene Summary
- Significant Phenotypes
- Measurements Chart
- All Data Table
- Expression Data
- Associated Images
- Disease Models
- Histopathology
- Order Mouse & ES Cells
Gene Summary

Click to enlarge image
At the top of each gene page, you will find a general summary for the gene:
- Gene Overview: Gene summary information such as viability, synonyms, embryo imaging availability and links to other resources
- Phenogrid: A grid of icons for each physiological system that is tested in the IMPC. Icons will be coloured depending on whether there are significant phenotypes in that system. Hover over icons for detail. A link to the body weight data is also available in this area.
- Follow a Gene: As we are systemically knocking out genes, some genes will not have phenotyping data. Following a gene will send you an email notification when the phenotyping status changes. You must be registered and logged in to follow a gene.
Phenotype Data

Click to enlarge image
Below the Gene Summary section is the phenotype data section. This section is made of three tabs:
1. The significant phenotypes tab
This tab lists all of the significant phenotypes found by the IMPC for the gene of interest. You can use the search function to look for a specific phenotype here.
- Table View: This table shows the significant phenotypes displayed when going to the IMPC pipeline. To be registered as a significant phenotype the P value must be less than 1.0E-4 (P < 0.0001).
- Chart Pages: By clicking on any phenotype row, you will be taken to one of our Chart Pages. The chart page displays the measurements for a specific parameter measured on an IMPC knockout line and the corresponding controls. These pages can differ in content depending on the parameter – some pages will be observation rates whilst others include statistical analysis details.
- Physiological system: The “System” column shows which physiological system the significant phenotype belongs to. This column is directly related to the Phenogrid in the gene summary at the top of the page.
- Download Data: You can download our the data from the Significant Phenotypes table in a .tsv or .xls format at the bottom of the table.
2. The measurements chart tab
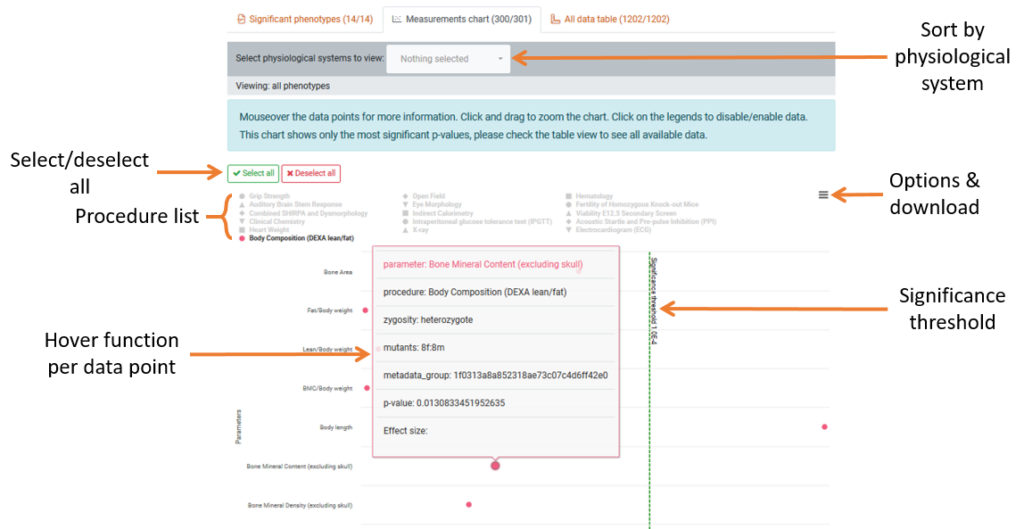
- Chart Visual: This displays each individual procedure performed and the parameters that were measured for the gene. The procedure is indicated by the coloured icon
- Significant Threshold: This threshold shows the point where a parameter becomes significant from the P-value of 1.0E-4 (P < 0.0001). Anything significant will be displayed on the right-hand side of this line.
- Sort by Procedure: To isolate results based on procedure, click procedure name in the key will toggle the visibility in the chart. To hide or show all procedures use the toggle buttons above the key. We recommend viewing one or two procedures at a time.
- Sort by Physiological System: You can filter all parameters by which physiological system is affected. The dropdown list is split into significant and non-significant groups which reflect the preview in the Phenogrid above.
- Parameter information: Hover over a parameter’s data point to be shown a preview window of the parameter data summary. Click the data point to be taken to the parameters data chart page for that gene.
3. The all data table tab
Click to enlarge image
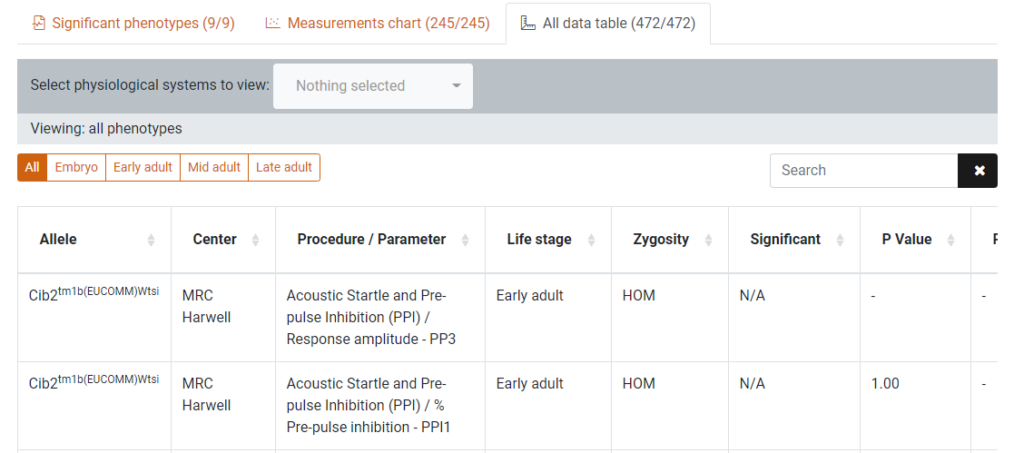
This tab displays the data in the measurements chart in a formatted table for a more detailed view of the Procedure/Parameter data. This table can be filtered by life stage (pipeline) and physiological system using button group and dropdown menu above the table.
Clicking on a row will direct you to the data chart page for that Procedure/Parameter.
Expression Data
Click to enlarge image
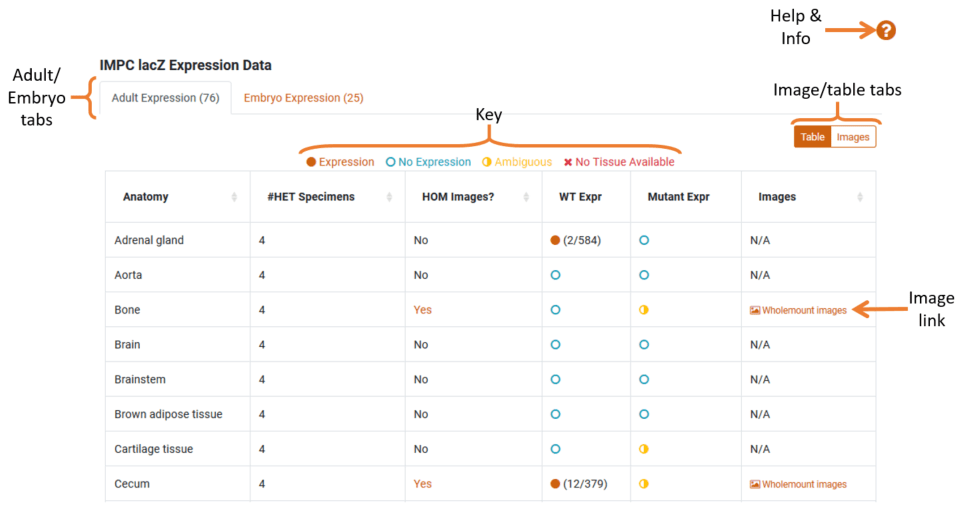
We use lacZ staining to categorise which mouse tissues the gene is being expressed in. In this section, we have two tabs to display Adult and Embryo expression data. The number in each tab indicates the number of mice found with expression.
- Expression Data: The expression table shows which anatomy tissue the gene is expressed in with a comparison between Wildtype and Mutant Mice. The key shows the distinction between the coloured icons in the expression columns.
- LacZ Images: If lacZ imaging has been performed for specific tissues there will be links in the ‘images’ column. Clicking on these links will take you to our image comparator page where you can visually compare wild-type and mutant lacZ images.
- Image View: By switching to image view (using the switcher in the top right-hand side) you will be able to view all available images grouped by anatomy.
If a tab has available expression data it will display a table with information on the different tissue types and expression rates.
Associated Images
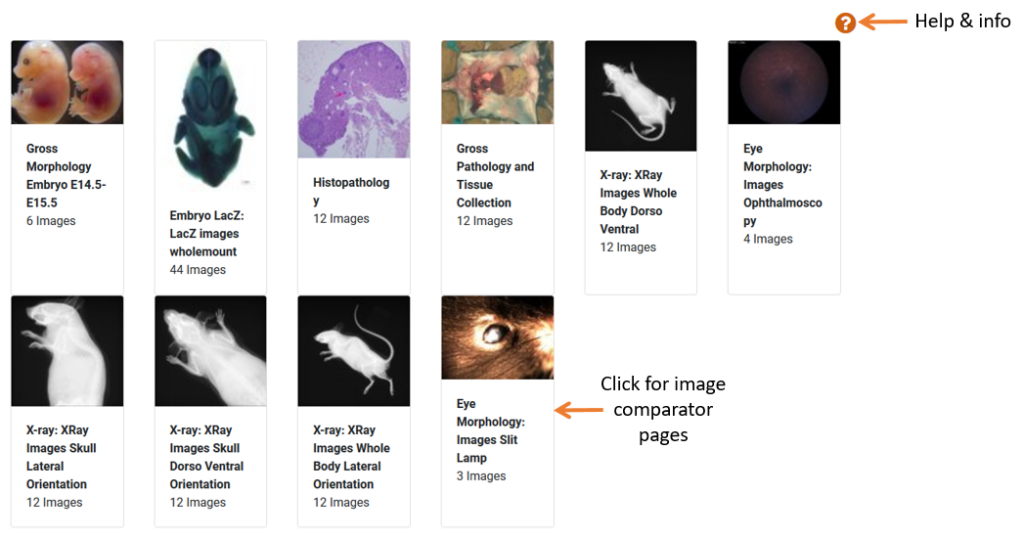
The associated images section will link to all available images for the gene of interest and can include:
- LacZ images
- X-Ray (various orientations)
- Eye Morphology
- Embryo Morphology
- Gross Pathology/tissue collection
- Histopathology
You can also find images by querying our SOLR cores. For documentation on how to achieve this, click the help icon.
Disease Models
Click to enlarge image
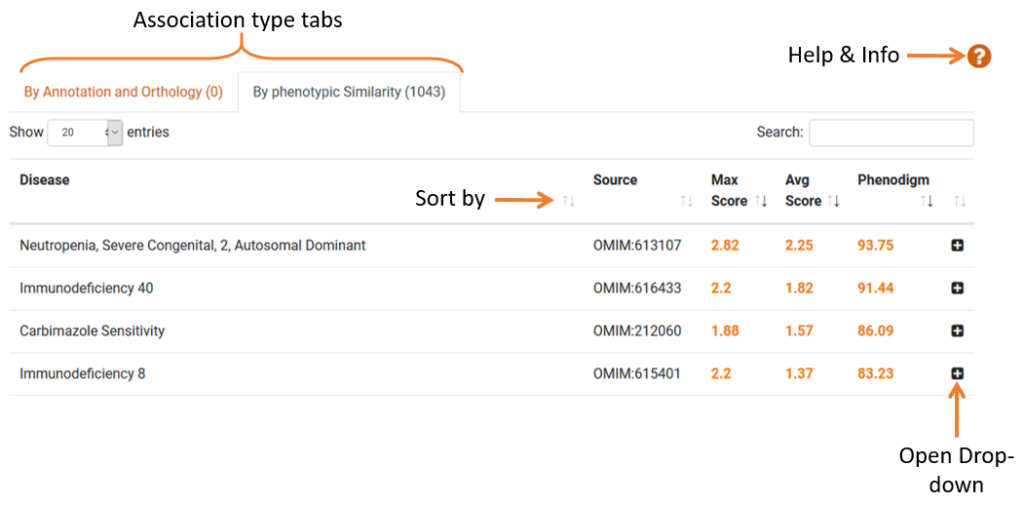
The Disease Model section lists human diseases associated with the gene. The data is sorted into 2 sections: “By Annotation and Orthology” and “By phenotypic Similarity”.
- Phenodigm Score: Phenodigm scores capture the similarity between a knockout mouse and a human disease, based on phenotypic similarity. Find more information on phenodigm scores via the help & info button.
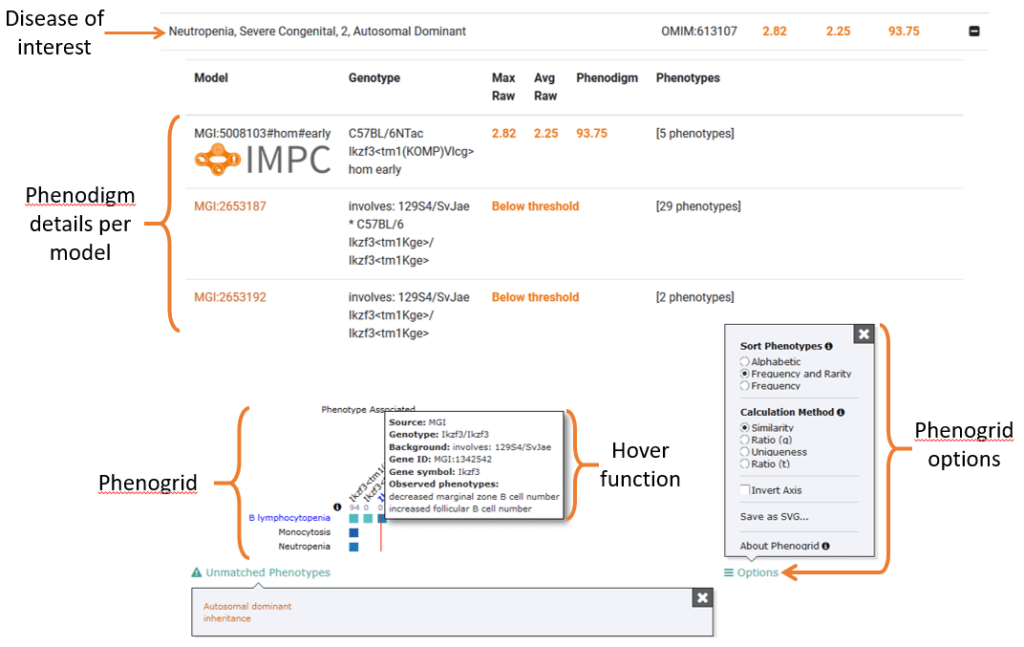
- Model Information: Clicking the row or the plus icon will expand the row which lists the mouse models and corresponding genotypes for the gene. It also rates each mouse model for phenotypic similarity to the disease of interest, expressed as a phenodigm score.
- Phenogrid: At the bottom of the expanded section is a grid which cross-references each model to disease-relevant phenotypes. The colour-coded squares express the similarity between the models’ phenotypes and disease phenotypes. These graphs are powered by one of our collaborators, The Monarch Initiative. This grid is fully interactive and view settings can be manipulated by using the “options” menu.
Click to enlarge image
Histopathology

Click to enlarge image
Some gene pages will have a histopathology section which displays a list of phenotypes that we have histopathology data for.
- Histology Pages: Clicking on a row will take you to a histopathology data page which lists all histopathology procedures in a table. For annotated mice, this page will provide information such as severity score and significance score, both of which are explained at the top of the page. We recommend sorting this list by severity or significance score to find relevant data quickly.
- Histology Images: The table also shows images and a description of the tissue abnormality observed. At the bottom of the histopathology page, under the Associated Images, you can find all associated histopathology images for the gene
Order Mouse & ES Cells
Click to enlarge image
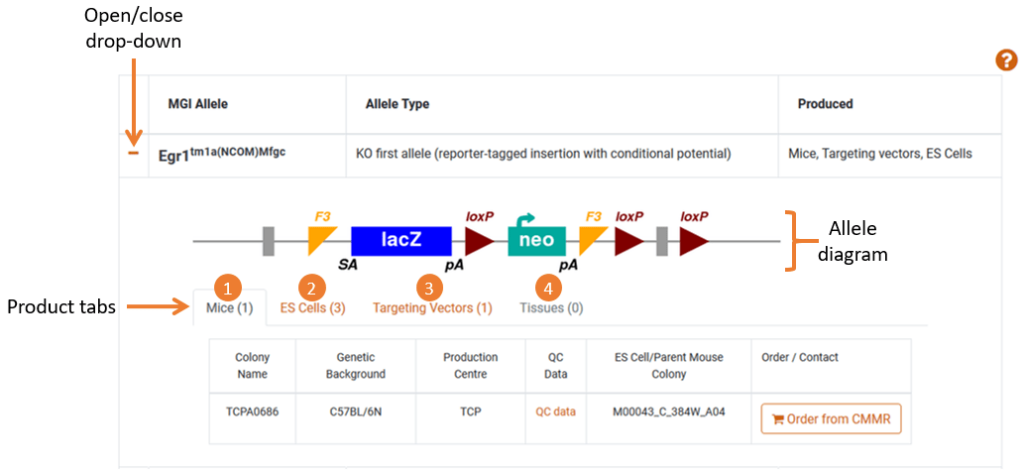
The table lists all alleles for the gene and the products that are available to order. Clicking the orange plus will reveal all product information which includes:
- Allele: A diagram (if available) of the intended allele
- Products: Tabs that indicate Mice, ES cells and/or Targeting vectors are available to order
- Tissue State: A tab indicating that tissues have been either embedded in paraffin or available on a slide
- Order Links: A link to order the product from the repository. Some links are to a partner website, some are email addresses where you can directly contact a centre about your enquiry

