
An interactive web-based tool for visualisation of tomographic embryo image data
Introduction
The Internet Embryo Viewer (IEV) is an interactive web application that allows users to visualise, navigate and compare tomographic image data of embryos imaged by optical projection tomography (OPT) and x-ray microtomography (micro-CT/µCT). IEV was designed primarily for research scientists who wish to view image data from mouse lines that are embryonic lethal, generated by the International Mouse Phenotyping Consortium (IMPC).
IEV was developed using the X Toolkit (https://github.com/xtk/X); a WebGL based platform for visualising medical image data in a web browser (for more information about XTK, see http://www.frontiersin.org/10.3389/conf.fninf.2014.08.00101/event_abstract). For optimal viewing, we recommend Chrome (https://www.google.com/chrome/browser/desktop/index.html).
Contact
If you experience any problems with IEV, or have any suggestions for future functionality, then please send an e-mail to wranglers@mousephenotype.org. For bugs, please let us know which browser you are using (Chrome/Firefox/IE/Opera).
Known issues
- IEV can become unresponsive/slow after being open for extended periods of time. In order to restore functionality, try refreshing the browser. To preserve your current view options, click the Save button and copy the URL.
- Individual embryos are downloaded in their entirety before being displayed (approx. 10Mb per embryo). As such, there may be a short delay before the data appears, especially on slow internet connections.
Overview
Global controls
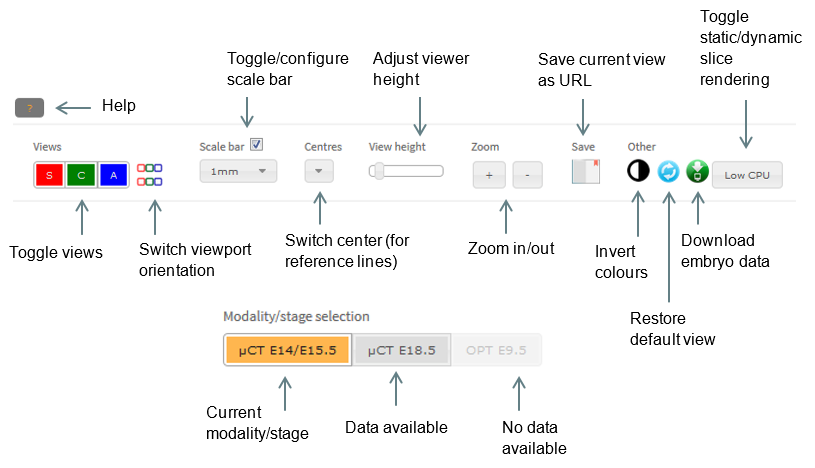
Viewer controls
Basic functions
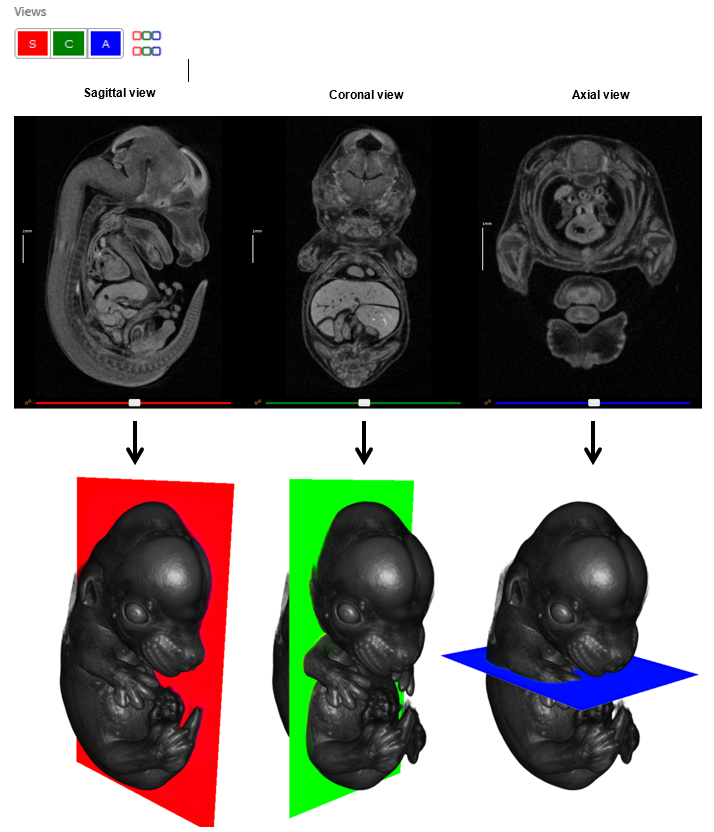
Orthogonal viewports
IEV provides three orthogonal views of the 3D data as sagittal, coronal and axial sections. These are displayed left to right by default. Individual viewports can be switched on and off in the Views panel by clicking the S, C and A buttons, respectively. Views can be displayed top to bottom by clicking the coloured toggle button in the Views panel.
Switching embryos
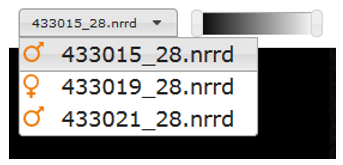
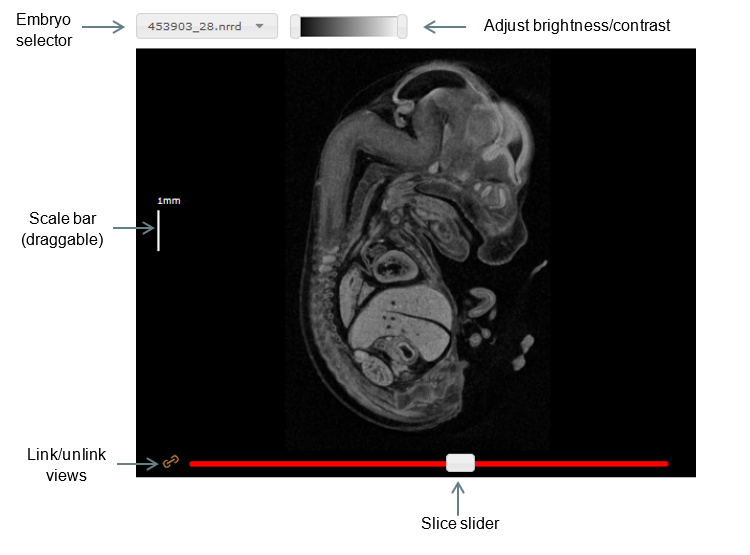
IEV has been designed as a comparative tool for genes that are embryonic lethal. Images of both wild-type (baseline) and mutant mice will be shown where available, allowing for direct comparison between two embryos at a time. Drop-down menus are located above each viewer, allowing users to select specific embryos for viewing. The orange icons indicate the sex of the embryo.
Slice navigation
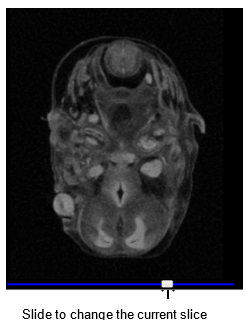
To change the current slice in one of the views, click and drag the slider at the bottom of the viewport, or mouse over one of the viewports and scroll the mouse wheel up or down.
Slices can also be navigated using the ‘crosshair’ mode, which allows for localisation of the same region in all three viewports. Holding down the ‘Shift’ key on the keyboard, move the mouse around one of the viewports. You will notice that the current slices in the other viewports will update according the mouse’s location, as indicated by the coloured crosshair.
Resizing, zooming and panning
To increase or decrease the height of the embryo viewports, drag the View height slider. To zoom in or out, click on the + or – buttons in the Zoom panel, respectively. To pan the view, click and drag the scroll wheel on your mouse (or left click and drag whilst holding down the shift key.)
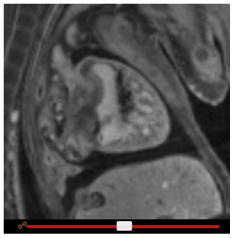
Adjusting colours
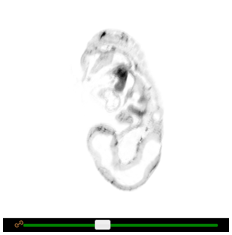
Brightness and contrast can be adjusted by dragging the two slider handles at the top of each embryo viewer. Alternatively, brightness can be adjusted by holding down the left mouse button on any viewport and dragging the mouse up or down. The same can be done for contrast, instead dragging left or right. To switch between colour schemes, click the ‘Invert colours’ button.
Linking views
By default, the wild-type and mutant viewers are linked such that dragging a slider in one viewer has the same effect in the corresponding viewer. To unlink them, simply click the orange ‘link’ button beside its slider.
In cases where embryos are not well aligned, a slider “offset” can be applied. Unlink the viewers, and adjust one slider until the same anatomical regions can be observed in both viewers. Re-linking the viewers will preserve this offset until the ‘Reset’ button is clicked.
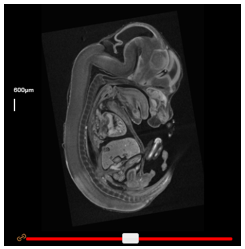
Scale bars
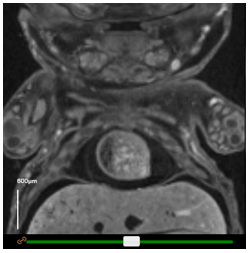
Scale bars can be turned on or off by clicking the checkbox under Scale bar in the top panel. The scale can then be modified by selecting the appropriate option in the dropdown box. For easy creation of figures, the bar may be dragged around the window to a more appropriate location.
Resetting the viewports
Clicking the ‘Reset’ button will restore the default slice, brightness, contrast, pan, and zoom levels to their default values.